|
Download Data (XLS File) |
|
|||||
|
|||||
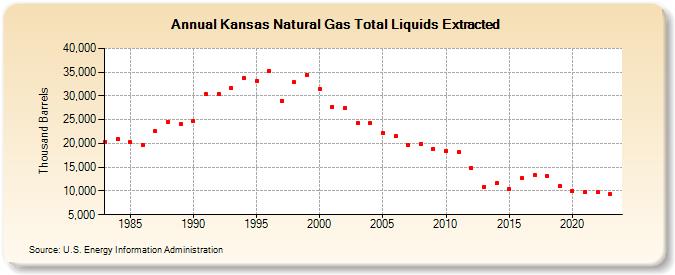
| Kansas Natural Gas Total Liquids Extracted (Thousand Barrels) | |||||
| Decade | Year-0 | Year-1 | Year-2 | Year-3 | Year-4 | Year-5 | Year-6 | Year-7 | Year-8 | Year-9 |
|---|---|---|---|---|---|---|---|---|---|---|
| 1980's | 20,400 | 20,831 | 20,235 | 19,708 | 22,606 | 24,585 | 24,177 | |||
| 1990's | 24,620 | 30,328 | 30,359 | 31,691 | 33,762 | 33,148 | 35,285 | 29,027 | 32,853 | 34,455 |
| 2000's | 31,407 | 27,754 | 27,439 | 24,311 | 24,278 | 22,165 | 21,509 | 19,600 | 19,856 | 18,863 |
| 2010's | 18,424 | 18,098 | 14,844 | 10,900 | 11,611 | 10,347 | 12,669 | 13,277 | 13,065 | 10,957 |
| 2020's | 9,956 | 9,732 | 9,746 | 9,316 | 7,305 |
| - = No Data Reported; -- = Not Applicable; NA = Not Available; W = Withheld to avoid disclosure of individual company data. |
| Release Date: 5/29/2026 |
| Next Release Date: 6/30/2026 |
Referring Pages: