|
Download Data (XLS File) |
|
|||||
|
|||||
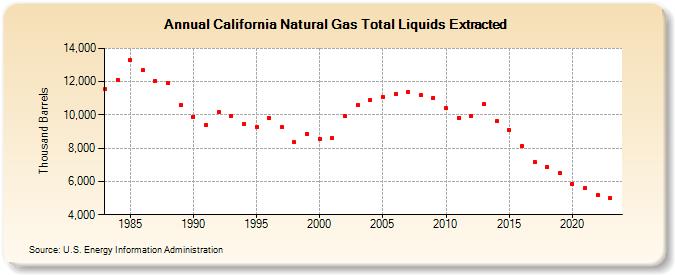
| California Natural Gas Total Liquids Extracted (Thousand Barrels) | |||||
| Decade | Year-0 | Year-1 | Year-2 | Year-3 | Year-4 | Year-5 | Year-6 | Year-7 | Year-8 | Year-9 |
|---|---|---|---|---|---|---|---|---|---|---|
| 1980's | 11,540 | 12,125 | 13,308 | 12,678 | 12,045 | 11,897 | 10,593 | |||
| 1990's | 9,905 | 9,389 | 10,171 | 9,944 | 9,425 | 9,302 | 9,798 | 9,246 | 8,351 | 8,848 |
| 2000's | 8,562 | 8,625 | 9,933 | 10,598 | 10,898 | 11,101 | 11,267 | 11,388 | 11,179 | 11,042 |
| 2010's | 10,400 | 9,831 | 9,923 | 10,641 | 9,605 | 9,086 | 8,121 | 7,158 | 6,873 | 6,501 |
| 2020's | 5,847 | 5,589 | 5,185 | 4,995 | 4,520 |
| - = No Data Reported; -- = Not Applicable; NA = Not Available; W = Withheld to avoid disclosure of individual company data. |
| Release Date: 5/29/2026 |
| Next Release Date: 6/30/2026 |