|
Download Data (XLS File) |
|
|||||
|
|||||
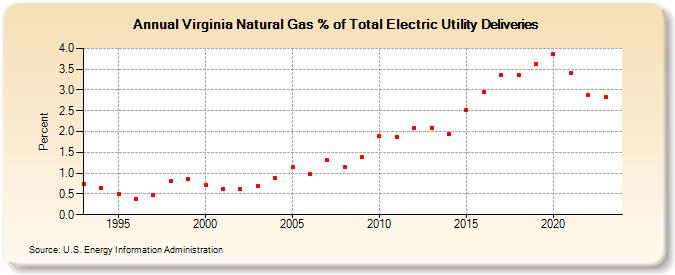
| Virginia Natural Gas % of Total Electric Utility Deliveries (Percent) | |||||
| Decade | Year-0 | Year-1 | Year-2 | Year-3 | Year-4 | Year-5 | Year-6 | Year-7 | Year-8 | Year-9 |
|---|---|---|---|---|---|---|---|---|---|---|
| 1990's | 0.74 | 0.64 | 0.51 | 0.38 | 0.47 | 0.82 | 0.86 | |||
| 2000's | 0.71 | 0.62 | 0.62 | 0.69 | 0.89 | 1.14 | 0.97 | 1.32 | 1.15 | 1.38 |
| 2010's | 1.89 | 1.88 | 2.08 | 2.09 | 1.95 | 2.53 | 2.95 | 3.36 | 3.37 | 3.63 |
| 2020's | 3.87 | 3.40 | 2.88 | 2.78 | 3.24 |
| - = No Data Reported; -- = Not Applicable; NA = Not Available; W = Withheld to avoid disclosure of individual company data. |
| Release Date: 5/29/2026 |
| Next Release Date: 6/30/2026 |