|
Download Data (XLS File) |
|
|||||
|
|||||
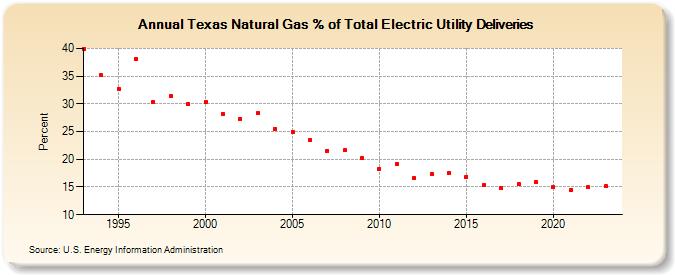
| Texas Natural Gas % of Total Electric Utility Deliveries (Percent) | |||||
| Decade | Year-0 | Year-1 | Year-2 | Year-3 | Year-4 | Year-5 | Year-6 | Year-7 | Year-8 | Year-9 |
|---|---|---|---|---|---|---|---|---|---|---|
| 1990's | 39.98 | 35.12 | 32.76 | 38.03 | 30.30 | 31.40 | 29.98 | |||
| 2000's | 30.30 | 28.19 | 27.33 | 28.31 | 25.52 | 24.98 | 23.52 | 21.54 | 21.60 | 20.19 |
| 2010's | 18.26 | 19.20 | 16.65 | 17.37 | 17.50 | 16.89 | 15.36 | 14.79 | 15.52 | 15.83 |
| 2020's | 14.95 | 14.49 | 14.93 | 15.59 | 15.74 |
| - = No Data Reported; -- = Not Applicable; NA = Not Available; W = Withheld to avoid disclosure of individual company data. |
| Release Date: 5/29/2026 |
| Next Release Date: 6/30/2026 |