|
Download Data (XLS File) |
|
|||||
|
|||||
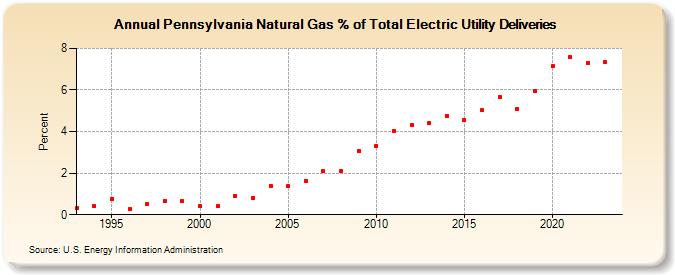
| Pennsylvania Natural Gas % of Total Electric Utility Deliveries (Percent) | |||||
| Decade | Year-0 | Year-1 | Year-2 | Year-3 | Year-4 | Year-5 | Year-6 | Year-7 | Year-8 | Year-9 |
|---|---|---|---|---|---|---|---|---|---|---|
| 1990's | 0.31 | 0.43 | 0.77 | 0.27 | 0.50 | 0.66 | 0.65 | |||
| 2000's | 0.40 | 0.42 | 0.89 | 0.80 | 1.39 | 1.37 | 1.62 | 2.10 | 2.11 | 3.06 |
| 2010's | 3.32 | 4.04 | 4.32 | 4.42 | 4.76 | 4.56 | 5.02 | 5.68 | 5.09 | 5.96 |
| 2020's | 7.13 | 7.59 | 7.31 | 7.34 | 7.39 |
| - = No Data Reported; -- = Not Applicable; NA = Not Available; W = Withheld to avoid disclosure of individual company data. |
| Release Date: 5/29/2026 |
| Next Release Date: 6/30/2026 |