|
Download Data (XLS File) |
|
|||||
|
|||||
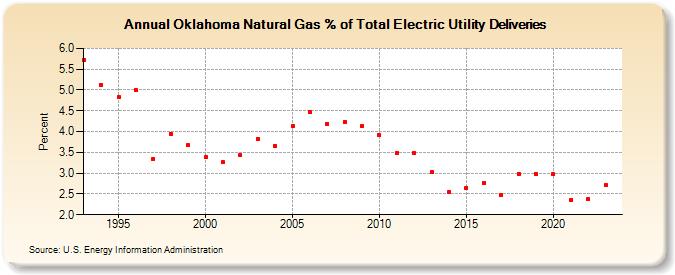
| Oklahoma Natural Gas % of Total Electric Utility Deliveries (Percent) | |||||
| Decade | Year-0 | Year-1 | Year-2 | Year-3 | Year-4 | Year-5 | Year-6 | Year-7 | Year-8 | Year-9 |
|---|---|---|---|---|---|---|---|---|---|---|
| 1990's | 5.73 | 5.13 | 4.82 | 4.99 | 3.33 | 3.95 | 3.67 | |||
| 2000's | 3.38 | 3.26 | 3.43 | 3.83 | 3.66 | 4.13 | 4.48 | 4.19 | 4.24 | 4.14 |
| 2010's | 3.91 | 3.49 | 3.49 | 3.02 | 2.55 | 2.65 | 2.77 | 2.47 | 2.99 | 2.99 |
| 2020's | 2.97 | 2.36 | 2.37 | 2.76 | 2.83 |
| - = No Data Reported; -- = Not Applicable; NA = Not Available; W = Withheld to avoid disclosure of individual company data. |
| Release Date: 5/29/2026 |
| Next Release Date: 6/30/2026 |