|
Download Data (XLS File) |
|
|||||
|
|||||
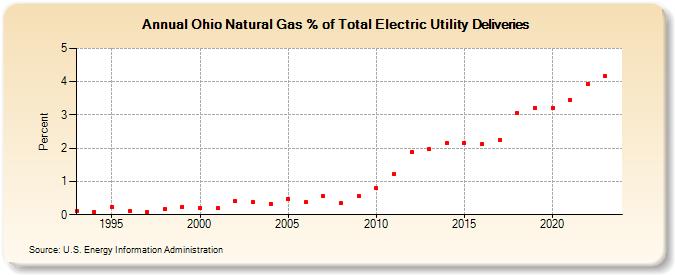
| Ohio Natural Gas % of Total Electric Utility Deliveries (Percent) | |||||
| Decade | Year-0 | Year-1 | Year-2 | Year-3 | Year-4 | Year-5 | Year-6 | Year-7 | Year-8 | Year-9 |
|---|---|---|---|---|---|---|---|---|---|---|
| 1990's | 0.10 | 0.09 | 0.23 | 0.11 | 0.09 | 0.17 | 0.24 | |||
| 2000's | 0.19 | 0.20 | 0.40 | 0.37 | 0.33 | 0.48 | 0.37 | 0.55 | 0.35 | 0.55 |
| 2010's | 0.79 | 1.23 | 1.88 | 1.97 | 2.15 | 2.17 | 2.13 | 2.24 | 3.05 | 3.22 |
| 2020's | 3.21 | 3.46 | 3.94 | 4.22 | 4.41 |
| - = No Data Reported; -- = Not Applicable; NA = Not Available; W = Withheld to avoid disclosure of individual company data. |
| Release Date: 5/29/2026 |
| Next Release Date: 6/30/2026 |