|
Download Data (XLS File) |
|
|||||
|
|||||
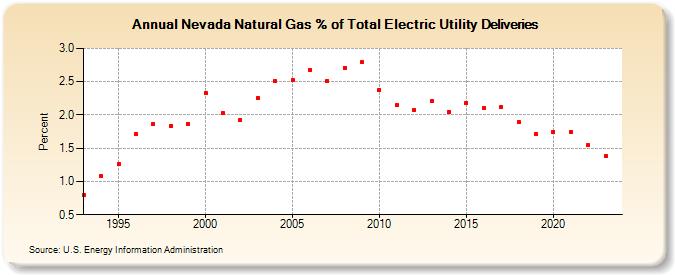
| Nevada Natural Gas % of Total Electric Utility Deliveries (Percent) | |||||
| Decade | Year-0 | Year-1 | Year-2 | Year-3 | Year-4 | Year-5 | Year-6 | Year-7 | Year-8 | Year-9 |
|---|---|---|---|---|---|---|---|---|---|---|
| 1990's | 0.79 | 1.08 | 1.26 | 1.71 | 1.86 | 1.83 | 1.87 | |||
| 2000's | 2.33 | 2.03 | 1.93 | 2.26 | 2.51 | 2.52 | 2.68 | 2.51 | 2.71 | 2.79 |
| 2010's | 2.38 | 2.15 | 2.08 | 2.21 | 2.05 | 2.18 | 2.10 | 2.12 | 1.89 | 1.71 |
| 2020's | 1.75 | 1.75 | 1.55 | 1.38 | 1.36 |
| - = No Data Reported; -- = Not Applicable; NA = Not Available; W = Withheld to avoid disclosure of individual company data. |
| Release Date: 3/31/2026 |
| Next Release Date: 4/30/2026 |