|
Download Data (XLS File) |
|
|||||
|
|||||
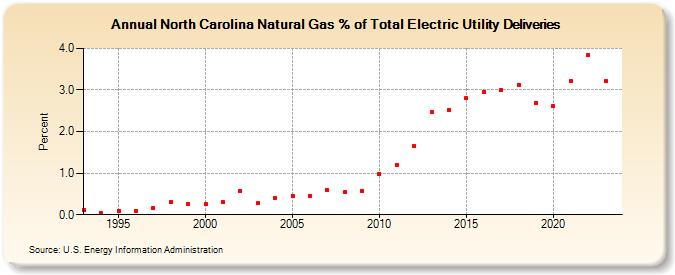
| North Carolina Natural Gas % of Total Electric Utility Deliveries (Percent) | |||||
| Decade | Year-0 | Year-1 | Year-2 | Year-3 | Year-4 | Year-5 | Year-6 | Year-7 | Year-8 | Year-9 |
|---|---|---|---|---|---|---|---|---|---|---|
| 1990's | 0.11 | 0.03 | 0.10 | 0.09 | 0.15 | 0.30 | 0.26 | |||
| 2000's | 0.25 | 0.30 | 0.56 | 0.28 | 0.39 | 0.46 | 0.46 | 0.59 | 0.54 | 0.58 |
| 2010's | 0.99 | 1.19 | 1.66 | 2.46 | 2.53 | 2.80 | 2.94 | 3.00 | 3.12 | 2.69 |
| 2020's | 2.61 | 3.21 | 3.83 | 3.09 | 3.20 |
| - = No Data Reported; -- = Not Applicable; NA = Not Available; W = Withheld to avoid disclosure of individual company data. |
| Release Date: 5/29/2026 |
| Next Release Date: 6/30/2026 |