|
Download Data (XLS File) |
|
|||||
|
|||||
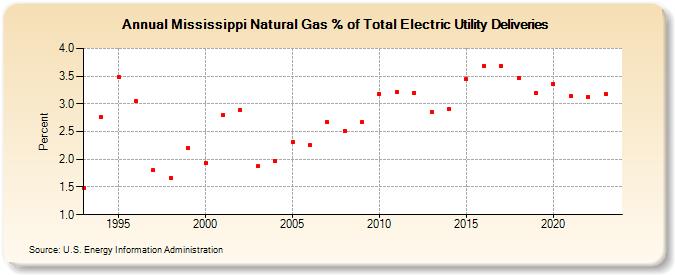
| Mississippi Natural Gas % of Total Electric Utility Deliveries (Percent) | |||||
| Decade | Year-0 | Year-1 | Year-2 | Year-3 | Year-4 | Year-5 | Year-6 | Year-7 | Year-8 | Year-9 |
|---|---|---|---|---|---|---|---|---|---|---|
| 1990's | 1.49 | 2.76 | 3.48 | 3.05 | 1.80 | 1.67 | 2.21 | |||
| 2000's | 1.93 | 2.80 | 2.89 | 1.87 | 1.97 | 2.31 | 2.25 | 2.67 | 2.51 | 2.67 |
| 2010's | 3.18 | 3.22 | 3.20 | 2.86 | 2.90 | 3.44 | 3.68 | 3.68 | 3.47 | 3.20 |
| 2020's | 3.36 | 3.14 | 3.13 | 3.12 | 3.21 |
| - = No Data Reported; -- = Not Applicable; NA = Not Available; W = Withheld to avoid disclosure of individual company data. |
| Release Date: 5/29/2026 |
| Next Release Date: 6/30/2026 |