|
Download Data (XLS File) |
|
|||||
|
|||||
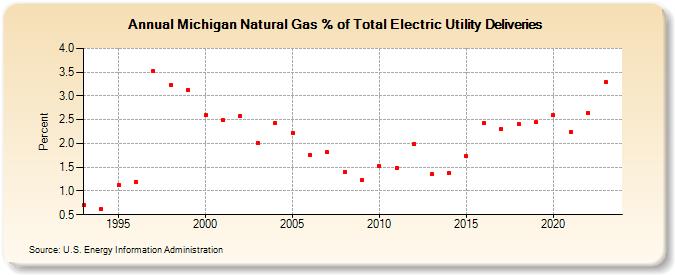
| Michigan Natural Gas % of Total Electric Utility Deliveries (Percent) | |||||
| Decade | Year-0 | Year-1 | Year-2 | Year-3 | Year-4 | Year-5 | Year-6 | Year-7 | Year-8 | Year-9 |
|---|---|---|---|---|---|---|---|---|---|---|
| 1990's | 0.70 | 0.61 | 1.12 | 1.19 | 3.52 | 3.23 | 3.12 | |||
| 2000's | 2.59 | 2.49 | 2.58 | 2.01 | 2.44 | 2.23 | 1.76 | 1.81 | 1.40 | 1.22 |
| 2010's | 1.53 | 1.49 | 1.99 | 1.35 | 1.37 | 1.73 | 2.43 | 2.30 | 2.40 | 2.45 |
| 2020's | 2.59 | 2.25 | 2.65 | 3.17 | 3.16 |
| - = No Data Reported; -- = Not Applicable; NA = Not Available; W = Withheld to avoid disclosure of individual company data. |
| Release Date: 5/29/2026 |
| Next Release Date: 6/30/2026 |