|
Download Data (XLS File) |
|
|||||
|
|||||
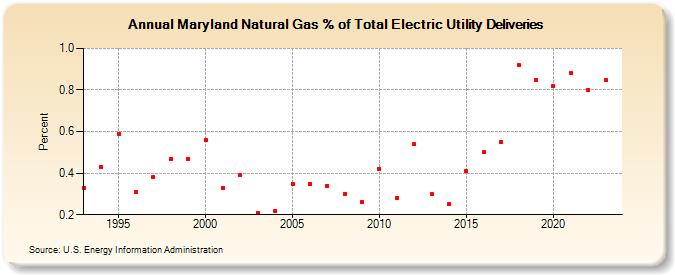
| Maryland Natural Gas % of Total Electric Utility Deliveries (Percent) | |||||
| Decade | Year-0 | Year-1 | Year-2 | Year-3 | Year-4 | Year-5 | Year-6 | Year-7 | Year-8 | Year-9 |
|---|---|---|---|---|---|---|---|---|---|---|
| 1990's | 0.33 | 0.43 | 0.59 | 0.31 | 0.38 | 0.47 | 0.47 | |||
| 2000's | 0.56 | 0.33 | 0.39 | 0.21 | 0.22 | 0.35 | 0.35 | 0.34 | 0.30 | 0.26 |
| 2010's | 0.42 | 0.28 | 0.54 | 0.30 | 0.25 | 0.41 | 0.50 | 0.55 | 0.92 | 0.85 |
| 2020's | 0.82 | 0.88 | 0.80 | 0.86 | 0.77 |
| - = No Data Reported; -- = Not Applicable; NA = Not Available; W = Withheld to avoid disclosure of individual company data. |
| Release Date: 5/29/2026 |
| Next Release Date: 6/30/2026 |