|
Download Data (XLS File) |
|
|||||
|
|||||
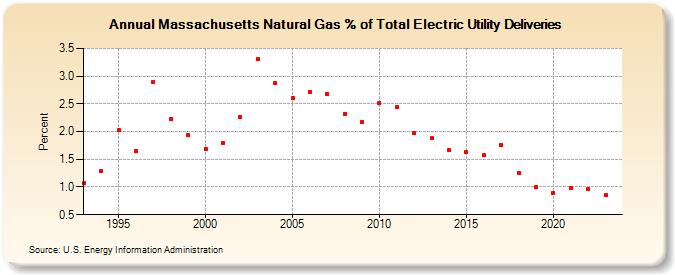
| Massachusetts Natural Gas % of Total Electric Utility Deliveries (Percent) | |||||
| Decade | Year-0 | Year-1 | Year-2 | Year-3 | Year-4 | Year-5 | Year-6 | Year-7 | Year-8 | Year-9 |
|---|---|---|---|---|---|---|---|---|---|---|
| 1990's | 1.07 | 1.29 | 2.02 | 1.65 | 2.89 | 2.22 | 1.93 | |||
| 2000's | 1.69 | 1.80 | 2.27 | 3.30 | 2.88 | 2.60 | 2.72 | 2.68 | 2.32 | 2.18 |
| 2010's | 2.52 | 2.45 | 1.97 | 1.88 | 1.66 | 1.63 | 1.57 | 1.76 | 1.26 | 1.00 |
| 2020's | 0.90 | 0.99 | 0.96 | 0.84 | 0.88 |
| - = No Data Reported; -- = Not Applicable; NA = Not Available; W = Withheld to avoid disclosure of individual company data. |
| Release Date: 5/29/2026 |
| Next Release Date: 6/30/2026 |