|
Download Data (XLS File) |
|
|||||
|
|||||
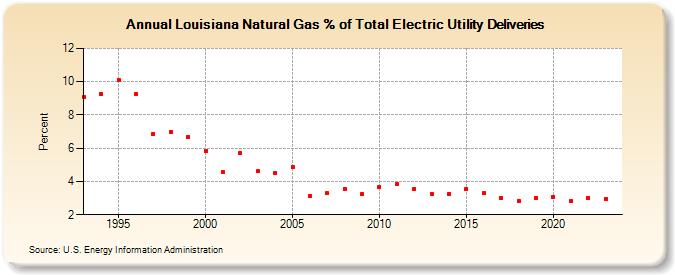
| Louisiana Natural Gas % of Total Electric Utility Deliveries (Percent) | |||||
| Decade | Year-0 | Year-1 | Year-2 | Year-3 | Year-4 | Year-5 | Year-6 | Year-7 | Year-8 | Year-9 |
|---|---|---|---|---|---|---|---|---|---|---|
| 1990's | 9.10 | 9.28 | 10.10 | 9.23 | 6.87 | 6.98 | 6.69 | |||
| 2000's | 5.85 | 4.55 | 5.71 | 4.60 | 4.49 | 4.86 | 3.15 | 3.28 | 3.55 | 3.24 |
| 2010's | 3.66 | 3.87 | 3.54 | 3.27 | 3.25 | 3.56 | 3.31 | 3.01 | 2.84 | 3.03 |
| 2020's | 3.06 | 2.83 | 3.02 | 2.93 | 3.00 |
| - = No Data Reported; -- = Not Applicable; NA = Not Available; W = Withheld to avoid disclosure of individual company data. |
| Release Date: 5/29/2026 |
| Next Release Date: 6/30/2026 |