|
Download Data (XLS File) |
|
|||||
|
|||||
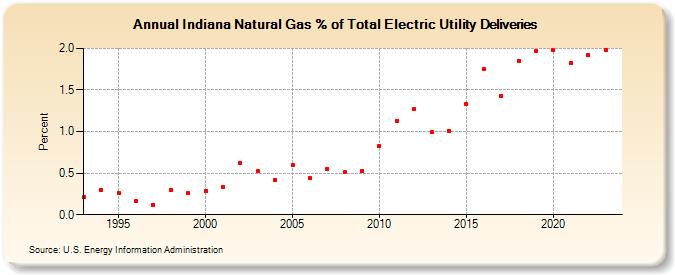
| Indiana Natural Gas % of Total Electric Utility Deliveries (Percent) | |||||
| Decade | Year-0 | Year-1 | Year-2 | Year-3 | Year-4 | Year-5 | Year-6 | Year-7 | Year-8 | Year-9 |
|---|---|---|---|---|---|---|---|---|---|---|
| 1990's | 0.21 | 0.30 | 0.26 | 0.16 | 0.12 | 0.30 | 0.26 | |||
| 2000's | 0.28 | 0.33 | 0.62 | 0.52 | 0.42 | 0.60 | 0.44 | 0.55 | 0.51 | 0.53 |
| 2010's | 0.83 | 1.13 | 1.27 | 0.99 | 1.01 | 1.33 | 1.75 | 1.43 | 1.85 | 1.97 |
| 2020's | 1.98 | 1.83 | 1.92 | 2.03 | 2.14 |
| - = No Data Reported; -- = Not Applicable; NA = Not Available; W = Withheld to avoid disclosure of individual company data. |
| Release Date: 5/29/2026 |
| Next Release Date: 6/30/2026 |