|
Download Data (XLS File) |
|
|||||
|
|||||
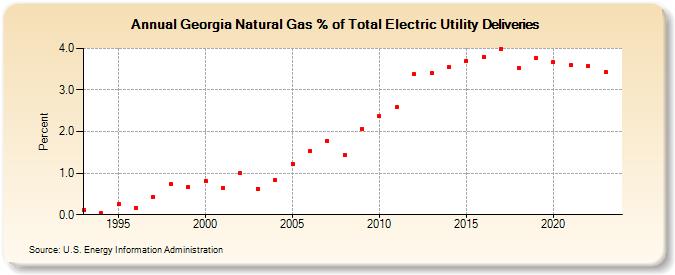
| Georgia Natural Gas % of Total Electric Utility Deliveries (Percent) | |||||
| Decade | Year-0 | Year-1 | Year-2 | Year-3 | Year-4 | Year-5 | Year-6 | Year-7 | Year-8 | Year-9 |
|---|---|---|---|---|---|---|---|---|---|---|
| 1990's | 0.11 | 0.03 | 0.25 | 0.17 | 0.42 | 0.73 | 0.67 | |||
| 2000's | 0.81 | 0.65 | 1.00 | 0.63 | 0.84 | 1.23 | 1.53 | 1.78 | 1.44 | 2.07 |
| 2010's | 2.37 | 2.59 | 3.38 | 3.41 | 3.56 | 3.70 | 3.80 | 3.99 | 3.53 | 3.78 |
| 2020's | 3.67 | 3.59 | 3.58 | 3.31 | 3.00 |
| - = No Data Reported; -- = Not Applicable; NA = Not Available; W = Withheld to avoid disclosure of individual company data. |
| Release Date: 5/29/2026 |
| Next Release Date: 6/30/2026 |