|
Download Data (XLS File) |
|
|||||
|
|||||
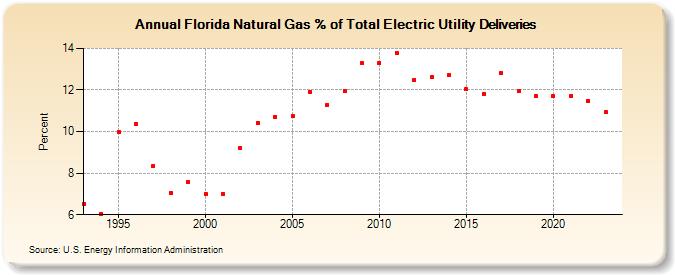
| Florida Natural Gas % of Total Electric Utility Deliveries (Percent) | |||||
| Decade | Year-0 | Year-1 | Year-2 | Year-3 | Year-4 | Year-5 | Year-6 | Year-7 | Year-8 | Year-9 |
|---|---|---|---|---|---|---|---|---|---|---|
| 1990's | 6.50 | 6.05 | 9.98 | 10.38 | 8.34 | 7.06 | 7.59 | |||
| 2000's | 7.00 | 7.01 | 9.20 | 10.42 | 10.72 | 10.74 | 11.92 | 11.30 | 11.96 | 13.29 |
| 2010's | 13.29 | 13.78 | 12.50 | 12.63 | 12.73 | 12.03 | 11.83 | 12.81 | 11.96 | 11.70 |
| 2020's | 11.69 | 11.73 | 11.49 | 10.86 | 10.79 |
| - = No Data Reported; -- = Not Applicable; NA = Not Available; W = Withheld to avoid disclosure of individual company data. |
| Release Date: 5/29/2026 |
| Next Release Date: 6/30/2026 |