|
Download Data (XLS File) |
|
||||||||
|
||||||||
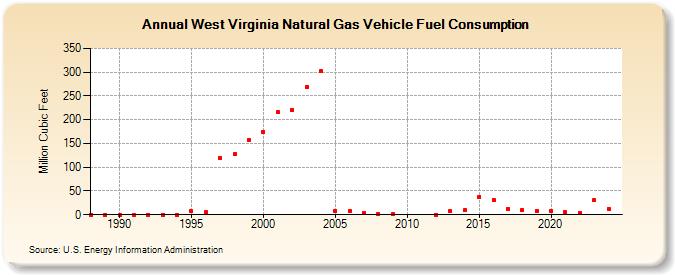
| West Virginia Natural Gas Vehicle Fuel Consumption (Million Cubic Feet) | ||||||||
| Decade | Year-0 | Year-1 | Year-2 | Year-3 | Year-4 | Year-5 | Year-6 | Year-7 | Year-8 | Year-9 |
|---|---|---|---|---|---|---|---|---|---|---|
| 1980's | 0 | 0 | ||||||||
| 1990's | 0 | 0 | 0 | 0 | 0 | 7 | 5 | 119 | 127 | 158 |
| 2000's | 174 | 216 | 220 | 269 | 302 | 8 | 8 | 4 | 2 | 1 |
| 2010's | 0 | 7 | 9 | 38 | 32 | 13 | 9 | 8 | ||
| 2020's | 8 | 5 | 4 | 30 | 41 | 34 |
| - = No Data Reported; -- = Not Applicable; NA = Not Available; W = Withheld to avoid disclosure of individual company data. |
| Release Date: 6/30/2026 |
| Next Release Date: 7/31/2026 |