|
Download Data (XLS File) |
|
|||||
|
|||||
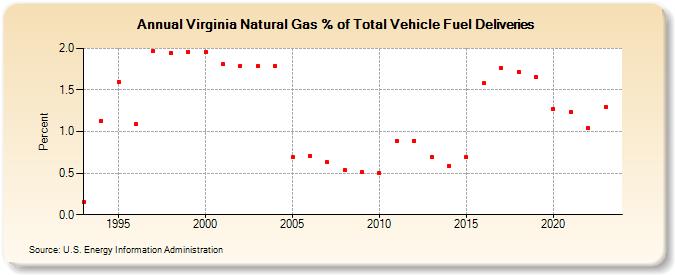
| Virginia Natural Gas % of Total Vehicle Fuel Deliveries (Percent) | |||||
| Decade | Year-0 | Year-1 | Year-2 | Year-3 | Year-4 | Year-5 | Year-6 | Year-7 | Year-8 | Year-9 |
|---|---|---|---|---|---|---|---|---|---|---|
| 1990's | 0.15 | 1.13 | 1.60 | 1.09 | 1.97 | 1.95 | 1.96 | |||
| 2000's | 1.96 | 1.81 | 1.79 | 1.79 | 1.79 | 0.69 | 0.71 | 0.63 | 0.54 | 0.51 |
| 2010's | 0.50 | 0.89 | 0.89 | 0.70 | 0.59 | 0.69 | 1.58 | 1.77 | 1.72 | 1.65 |
| 2020's | 1.27 | 1.24 | 1.04 | 1.35 | 1.39 |
| - = No Data Reported; -- = Not Applicable; NA = Not Available; W = Withheld to avoid disclosure of individual company data. |
| Release Date: 5/29/2026 |
| Next Release Date: 6/30/2026 |