|
Download Data (XLS File) |
|
||||||||
|
||||||||
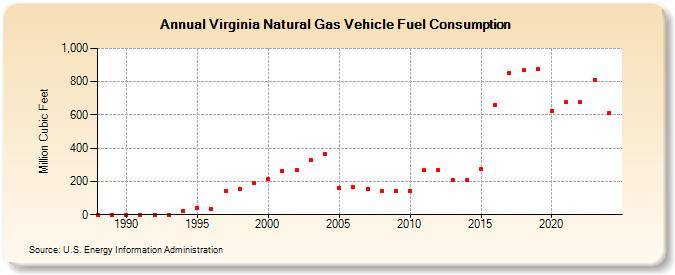
| Virginia Natural Gas Vehicle Fuel Consumption (Million Cubic Feet) | ||||||||
| Decade | Year-0 | Year-1 | Year-2 | Year-3 | Year-4 | Year-5 | Year-6 | Year-7 | Year-8 | Year-9 |
|---|---|---|---|---|---|---|---|---|---|---|
| 1980's | 0 | 0 | ||||||||
| 1990's | 0 | 0 | 0 | 1 | 20 | 43 | 32 | 142 | 154 | 193 |
| 2000's | 212 | 263 | 268 | 328 | 368 | 158 | 168 | 154 | 141 | 140 |
| 2010's | 142 | 267 | 266 | 210 | 207 | 272 | 662 | 853 | 868 | 875 |
| 2020's | 626 | 675 | 675 | 809 | 886 | 740 |
| - = No Data Reported; -- = Not Applicable; NA = Not Available; W = Withheld to avoid disclosure of individual company data. |
| Release Date: 6/30/2026 |
| Next Release Date: 7/31/2026 |