|
Download Data (XLS File) |
|
|||||
|
|||||
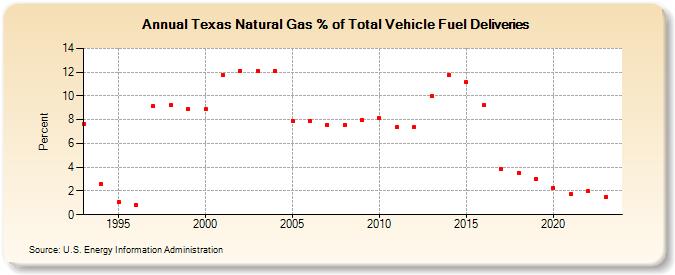
| Texas Natural Gas % of Total Vehicle Fuel Deliveries (Percent) | |||||
| Decade | Year-0 | Year-1 | Year-2 | Year-3 | Year-4 | Year-5 | Year-6 | Year-7 | Year-8 | Year-9 |
|---|---|---|---|---|---|---|---|---|---|---|
| 1990's | 7.61 | 2.60 | 1.08 | 0.82 | 9.12 | 9.20 | 8.86 | |||
| 2000's | 8.86 | 11.80 | 12.12 | 12.11 | 12.11 | 7.92 | 7.86 | 7.58 | 7.57 | 8.00 |
| 2010's | 8.14 | 7.35 | 7.36 | 10.00 | 11.80 | 11.14 | 9.22 | 3.82 | 3.54 | 2.99 |
| 2020's | 2.27 | 1.72 | 1.96 | 1.54 | 4.26 |
| - = No Data Reported; -- = Not Applicable; NA = Not Available; W = Withheld to avoid disclosure of individual company data. |
| Release Date: 5/29/2026 |
| Next Release Date: 6/30/2026 |