|
Download Data (XLS File) |
|
||||||||
|
||||||||
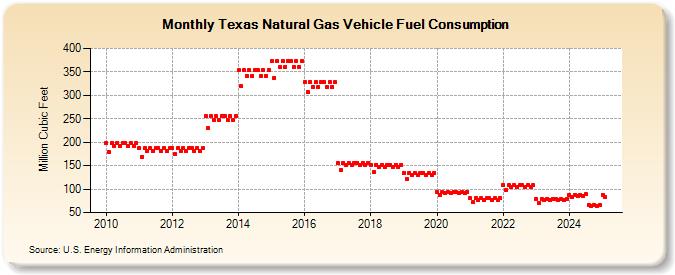
| Texas Natural Gas Vehicle Fuel Consumption (Million Cubic Feet) | ||||||||
| Year | Jan | Feb | Mar | Apr | May | Jun | Jul | Aug | Sep | Oct | Nov | Dec |
|---|---|---|---|---|---|---|---|---|---|---|---|---|
| 2010 | 198 | 179 | 198 | 192 | 198 | 192 | 198 | 198 | 192 | 198 | 192 | 198 |
| 2011 | 187 | 169 | 187 | 181 | 187 | 181 | 187 | 187 | 181 | 187 | 181 | 187 |
| 2012 | 187 | 175 | 187 | 181 | 187 | 181 | 187 | 187 | 181 | 187 | 181 | 187 |
| 2013 | 255 | 230 | 255 | 247 | 255 | 247 | 255 | 255 | 247 | 255 | 247 | 255 |
| 2014 | 353 | 319 | 353 | 342 | 353 | 342 | 353 | 353 | 342 | 353 | 342 | 353 |
| 2015 | 373 | 337 | 373 | 361 | 373 | 361 | 373 | 373 | 361 | 373 | 361 | 373 |
| 2016 | 328 | 307 | 328 | 318 | 328 | 318 | 328 | 328 | 318 | 328 | 318 | 328 |
| 2017 | 156 | 141 | 156 | 151 | 156 | 151 | 156 | 156 | 151 | 156 | 151 | 156 |
| 2018 | 152 | 137 | 152 | 147 | 152 | 147 | 152 | 152 | 147 | 152 | 147 | 152 |
| 2019 | 135 | 122 | 135 | 130 | 135 | 130 | 135 | 135 | 130 | 135 | 130 | 135 |
| 2020 | 94 | 88 | 94 | 91 | 94 | 91 | 94 | 94 | 91 | 94 | 91 | 94 |
| 2021 | 80 | 72 | 80 | 77 | 80 | 77 | 80 | 80 | 77 | 80 | 77 | 80 |
| 2022 | 108 | 98 | 108 | 105 | 108 | 105 | 108 | 108 | 105 | 108 | 105 | 108 |
| 2023 | 79 | 71 | 79 | 76 | 79 | 76 | 79 | 79 | 76 | 79 | 76 | 79 |
| 2024 | 230 | 215 | 230 | 222 | 230 | 222 | 230 | 230 | 222 | 230 | 222 | 230 |
| 2025 | 192 | 174 | 192 | 186 | 192 | 186 | 192 | 192 | 186 | 192 | 186 | 192 |
| 2026 | 192 | 174 | 192 | 186 | ||||||||
| - = No Data Reported; -- = Not Applicable; NA = Not Available; W = Withheld to avoid disclosure of individual company data. |
| Release Date: 6/30/2026 |
| Next Release Date: 7/31/2026 |