|
Download Data (XLS File) |
|
||||||||
|
||||||||
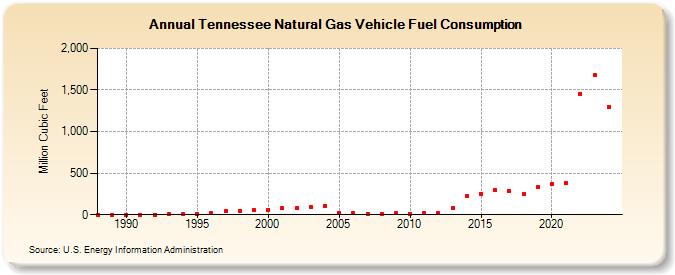
| Tennessee Natural Gas Vehicle Fuel Consumption (Million Cubic Feet) | ||||||||
| Decade | Year-0 | Year-1 | Year-2 | Year-3 | Year-4 | Year-5 | Year-6 | Year-7 | Year-8 | Year-9 |
|---|---|---|---|---|---|---|---|---|---|---|
| 1980's | 0 | 0 | ||||||||
| 1990's | 2 | 1 | 2 | 4 | 5 | 3 | 15 | 44 | 45 | 56 |
| 2000's | 62 | 77 | 78 | 95 | 107 | 21 | 17 | 14 | 14 | 16 |
| 2010's | 14 | 17 | 17 | 86 | 221 | 255 | 297 | 285 | 247 | 335 |
| 2020's | 375 | 379 | 1,456 | 389 | 459 | 384 |
| - = No Data Reported; -- = Not Applicable; NA = Not Available; W = Withheld to avoid disclosure of individual company data. |
| Release Date: 6/30/2026 |
| Next Release Date: 7/31/2026 |