|
Download Data (XLS File) |
|
||||||||
|
||||||||
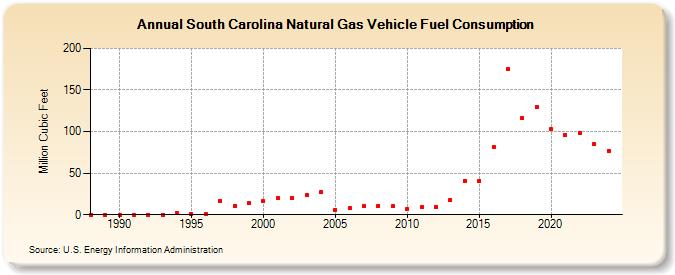
| South Carolina Natural Gas Vehicle Fuel Consumption (Million Cubic Feet) | ||||||||
| Decade | Year-0 | Year-1 | Year-2 | Year-3 | Year-4 | Year-5 | Year-6 | Year-7 | Year-8 | Year-9 |
|---|---|---|---|---|---|---|---|---|---|---|
| 1980's | 0 | 0 | ||||||||
| 1990's | 0 | 0 | 0 | 0 | 2 | 1 | 1 | 17 | 11 | 14 |
| 2000's | 16 | 20 | 20 | 24 | 27 | 6 | 8 | 10 | 11 | 10 |
| 2010's | 7 | 9 | 9 | 18 | 41 | 41 | 82 | 175 | 116 | 130 |
| 2020's | 103 | 96 | 98 | 85 | 90 | 75 |
| - = No Data Reported; -- = Not Applicable; NA = Not Available; W = Withheld to avoid disclosure of individual company data. |
| Release Date: 6/30/2026 |
| Next Release Date: 7/31/2026 |