|
Download Data (XLS File) |
|
|||||
|
|||||
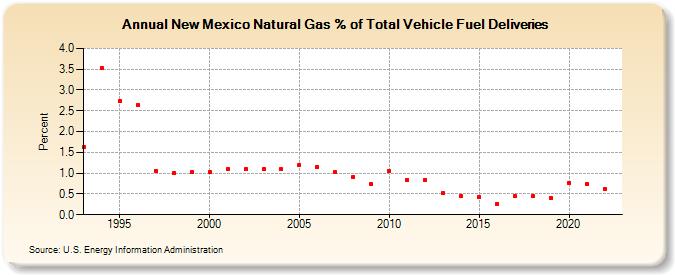
| New Mexico Natural Gas % of Total Vehicle Fuel Deliveries (Percent) | |||||
| Decade | Year-0 | Year-1 | Year-2 | Year-3 | Year-4 | Year-5 | Year-6 | Year-7 | Year-8 | Year-9 |
|---|---|---|---|---|---|---|---|---|---|---|
| 1990's | 1.62 | 3.54 | 2.74 | 2.64 | 1.06 | 1.00 | 1.02 | |||
| 2000's | 1.02 | 1.09 | 1.09 | 1.09 | 1.09 | 1.20 | 1.15 | 1.02 | 0.91 | 0.73 |
| 2010's | 1.05 | 0.83 | 0.84 | 0.52 | 0.44 | 0.43 | 0.26 | 0.44 | 0.45 | 0.41 |
| 2020's | 0.77 | 0.73 | 0.62 | 0.64 | 0.66 |
| - = No Data Reported; -- = Not Applicable; NA = Not Available; W = Withheld to avoid disclosure of individual company data. |
| Release Date: 6/30/2026 |
| Next Release Date: 7/31/2026 |