|
Download Data (XLS File) |
|
||||||||
|
||||||||
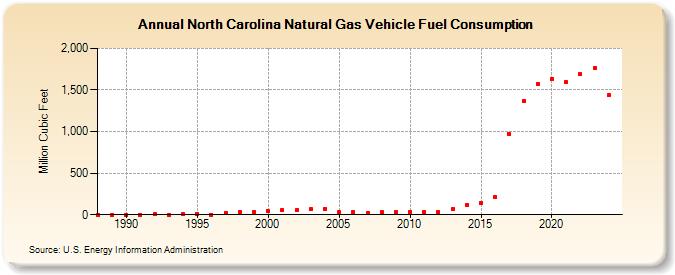
| North Carolina Natural Gas Vehicle Fuel Consumption (Million Cubic Feet) | ||||||||
| Decade | Year-0 | Year-1 | Year-2 | Year-3 | Year-4 | Year-5 | Year-6 | Year-7 | Year-8 | Year-9 |
|---|---|---|---|---|---|---|---|---|---|---|
| 1980's | 0 | 0 | ||||||||
| 1990's | 2 | 1 | 7 | 1 | 8 | 9 | 0 | 24 | 31 | 38 |
| 2000's | 43 | 53 | 54 | 66 | 74 | 31 | 28 | 20 | 31 | 27 |
| 2010's | 32 | 30 | 30 | 71 | 121 | 141 | 210 | 972 | 1,369 | 1,575 |
| 2020's | 1,633 | 1,595 | 1,687 | 1,765 | 894 | 747 |
| - = No Data Reported; -- = Not Applicable; NA = Not Available; W = Withheld to avoid disclosure of individual company data. |
| Release Date: 6/30/2026 |
| Next Release Date: 7/31/2026 |