|
Download Data (XLS File) |
|
|||||
|
|||||
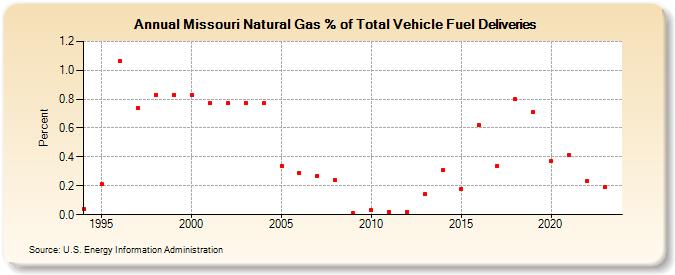
| Missouri Natural Gas % of Total Vehicle Fuel Deliveries (Percent) | |||||
| Decade | Year-0 | Year-1 | Year-2 | Year-3 | Year-4 | Year-5 | Year-6 | Year-7 | Year-8 | Year-9 |
|---|---|---|---|---|---|---|---|---|---|---|
| 1990's | 0.04 | 0.21 | 1.06 | 0.74 | 0.83 | 0.83 | ||||
| 2000's | 0.83 | 0.77 | 0.77 | 0.77 | 0.77 | 0.34 | 0.29 | 0.27 | 0.24 | 0.01 |
| 2010's | 0.03 | 0.02 | 0.02 | 0.14 | 0.31 | 0.18 | 0.62 | 0.34 | 0.80 | 0.71 |
| 2020's | 0.37 | 0.41 | 0.23 | 0.20 | 0.17 |
| - = No Data Reported; -- = Not Applicable; NA = Not Available; W = Withheld to avoid disclosure of individual company data. |
| Release Date: 5/29/2026 |
| Next Release Date: 6/30/2026 |