|
Download Data (XLS File) |
|
||||||||
|
||||||||
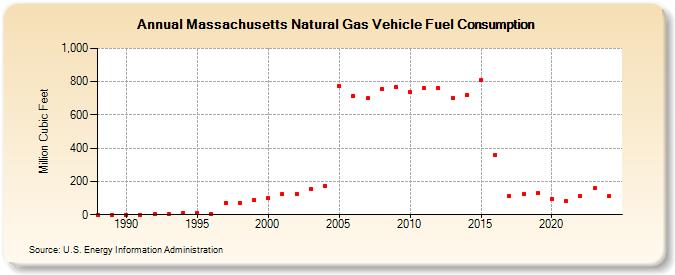
| Massachusetts Natural Gas Vehicle Fuel Consumption (Million Cubic Feet) | ||||||||
| Decade | Year-0 | Year-1 | Year-2 | Year-3 | Year-4 | Year-5 | Year-6 | Year-7 | Year-8 | Year-9 |
|---|---|---|---|---|---|---|---|---|---|---|
| 1980's | 0 | 0 | ||||||||
| 1990's | 0 | 1 | 2 | 2 | 9 | 12 | 5 | 71 | 73 | 91 |
| 2000's | 101 | 125 | 126 | 154 | 173 | 772 | 715 | 700 | 758 | 769 |
| 2010's | 735 | 760 | 761 | 699 | 719 | 809 | 362 | 113 | 127 | 130 |
| 2020's | 93 | 80 | 114 | 158 | 133 | 111 |
| - = No Data Reported; -- = Not Applicable; NA = Not Available; W = Withheld to avoid disclosure of individual company data. |
| Release Date: 6/30/2026 |
| Next Release Date: 7/31/2026 |