|
Download Data (XLS File) |
|
|||||
|
|||||
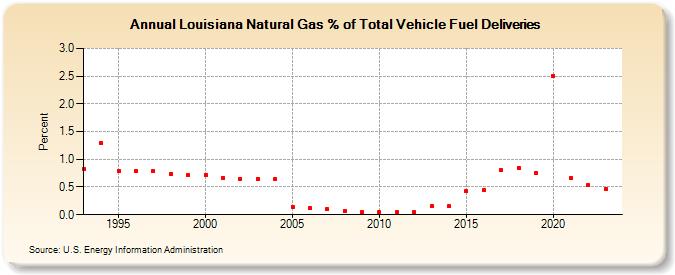
| Louisiana Natural Gas % of Total Vehicle Fuel Deliveries (Percent) | |||||
| Decade | Year-0 | Year-1 | Year-2 | Year-3 | Year-4 | Year-5 | Year-6 | Year-7 | Year-8 | Year-9 |
|---|---|---|---|---|---|---|---|---|---|---|
| 1990's | 0.83 | 1.29 | 0.79 | 0.78 | 0.78 | 0.73 | 0.71 | |||
| 2000's | 0.72 | 0.67 | 0.65 | 0.65 | 0.65 | 0.14 | 0.12 | 0.10 | 0.07 | 0.04 |
| 2010's | 0.04 | 0.04 | 0.04 | 0.15 | 0.15 | 0.42 | 0.45 | 0.80 | 0.85 | 0.75 |
| 2020's | 2.51 | 0.66 | 0.53 | 0.47 | 0.42 |
| - = No Data Reported; -- = Not Applicable; NA = Not Available; W = Withheld to avoid disclosure of individual company data. |
| Release Date: 5/29/2026 |
| Next Release Date: 6/30/2026 |