|
Download Data (XLS File) |
|
|||||
|
|||||
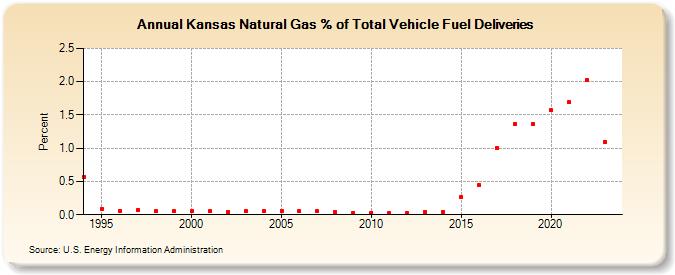
| Kansas Natural Gas % of Total Vehicle Fuel Deliveries (Percent) | |||||
| Decade | Year-0 | Year-1 | Year-2 | Year-3 | Year-4 | Year-5 | Year-6 | Year-7 | Year-8 | Year-9 |
|---|---|---|---|---|---|---|---|---|---|---|
| 1990's | 0.57 | 0.09 | 0.06 | 0.07 | 0.05 | 0.05 | ||||
| 2000's | 0.05 | 0.05 | 0.04 | 0.05 | 0.05 | 0.06 | 0.05 | 0.05 | 0.04 | 0.03 |
| 2010's | 0.03 | 0.02 | 0.02 | 0.04 | 0.04 | 0.26 | 0.44 | 1.00 | 1.36 | 1.37 |
| 2020's | 1.57 | 1.69 | 2.02 | 1.13 | 0.92 |
| - = No Data Reported; -- = Not Applicable; NA = Not Available; W = Withheld to avoid disclosure of individual company data. |
| Release Date: 5/29/2026 |
| Next Release Date: 6/30/2026 |