|
Download Data (XLS File) |
|
||||||||
|
||||||||
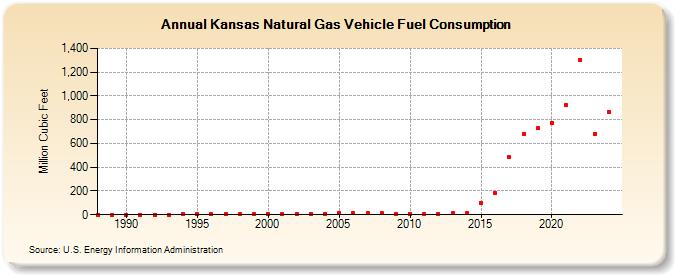
| Kansas Natural Gas Vehicle Fuel Consumption (Million Cubic Feet) | ||||||||
| Decade | Year-0 | Year-1 | Year-2 | Year-3 | Year-4 | Year-5 | Year-6 | Year-7 | Year-8 | Year-9 |
|---|---|---|---|---|---|---|---|---|---|---|
| 1980's | 0 | 0 | ||||||||
| 1990's | 0 | 0 | 0 | 0 | 10 | 2 | 2 | 5 | 4 | 5 |
| 2000's | 5 | 7 | 7 | 9 | 10 | 13 | 12 | 13 | 11 | 9 |
| 2010's | 9 | 7 | 7 | 12 | 15 | 101 | 186 | 483 | 683 | 729 |
| 2020's | 771 | 920 | 1,306 | 681 | 587 | 490 |
| - = No Data Reported; -- = Not Applicable; NA = Not Available; W = Withheld to avoid disclosure of individual company data. |
| Release Date: 6/30/2026 |
| Next Release Date: 7/31/2026 |