|
Download Data (XLS File) |
|
||||||||
|
||||||||
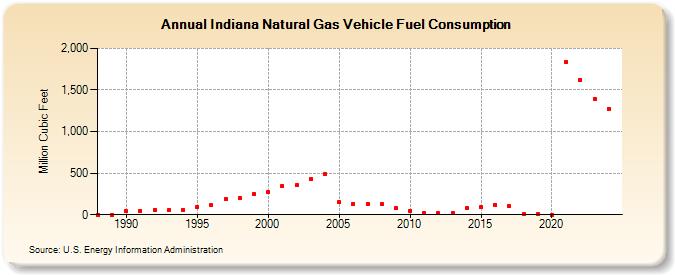
| Indiana Natural Gas Vehicle Fuel Consumption (Million Cubic Feet) | ||||||||
| Decade | Year-0 | Year-1 | Year-2 | Year-3 | Year-4 | Year-5 | Year-6 | Year-7 | Year-8 | Year-9 |
|---|---|---|---|---|---|---|---|---|---|---|
| 1980's | 0 | 0 | ||||||||
| 1990's | 40 | 49 | 59 | 54 | 59 | 98 | 112 | 187 | 199 | 248 |
| 2000's | 273 | 347 | 355 | 434 | 487 | 147 | 131 | 128 | 123 | 77 |
| 2010's | 50 | 17 | 17 | 22 | 82 | 93 | 121 | 101 | 8 | 4 |
| 2020's | 2 | 1,841 | 1,624 | 1,397 | 1,503 | 1,256 |
| - = No Data Reported; -- = Not Applicable; NA = Not Available; W = Withheld to avoid disclosure of individual company data. |
| Release Date: 6/30/2026 |
| Next Release Date: 7/31/2026 |