|
Download Data (XLS File) |
|
|||||
|
|||||
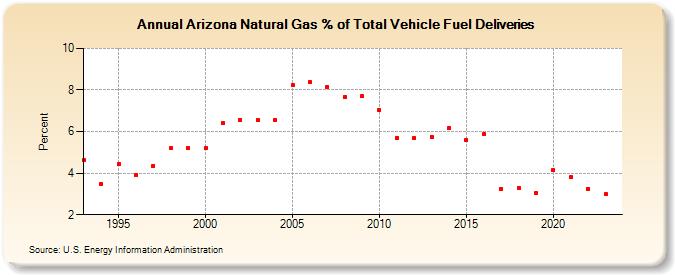
| Arizona Natural Gas % of Total Vehicle Fuel Deliveries (Percent) | |||||
| Decade | Year-0 | Year-1 | Year-2 | Year-3 | Year-4 | Year-5 | Year-6 | Year-7 | Year-8 | Year-9 |
|---|---|---|---|---|---|---|---|---|---|---|
| 1990's | 4.61 | 3.49 | 4.43 | 3.91 | 4.36 | 5.19 | 5.20 | |||
| 2000's | 5.20 | 6.40 | 6.57 | 6.57 | 6.57 | 8.25 | 8.38 | 8.15 | 7.66 | 7.69 |
| 2010's | 7.03 | 5.71 | 5.70 | 5.76 | 6.18 | 5.60 | 5.88 | 3.25 | 3.29 | 3.05 |
| 2020's | 4.13 | 3.80 | 3.26 | 3.08 | 2.46 |
| - = No Data Reported; -- = Not Applicable; NA = Not Available; W = Withheld to avoid disclosure of individual company data. |
| Release Date: 5/29/2026 |
| Next Release Date: 6/30/2026 |