|
Download Data (XLS File) |
|
|||||
|
|||||
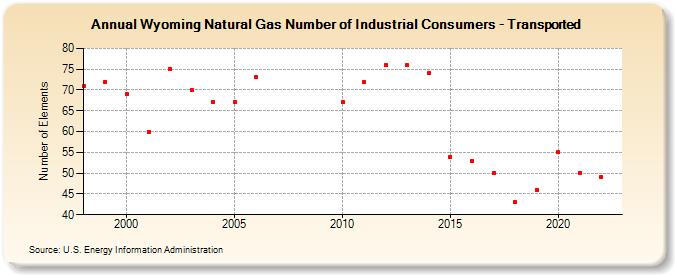
| Wyoming Natural Gas Number of Industrial Consumers - Transported (Number of Elements) | |||||
| Decade | Year-0 | Year-1 | Year-2 | Year-3 | Year-4 | Year-5 | Year-6 | Year-7 | Year-8 | Year-9 |
|---|---|---|---|---|---|---|---|---|---|---|
| 1990's | 71 | 72 | ||||||||
| 2000's | 69 | 60 | 75 | 70 | 67 | 67 | 73 | |||
| 2010's | 67 | 72 | 76 | 76 | 74 | 54 | 53 | 50 | 43 | 46 |
| 2020's | 55 | 50 | 49 | 51 | 51 |
| - = No Data Reported; -- = Not Applicable; NA = Not Available; W = Withheld to avoid disclosure of individual company data. |
| Release Date: 6/30/2026 |
| Next Release Date: 7/31/2026 |