|
Download Data (XLS File) |
|
|||||
|
|||||
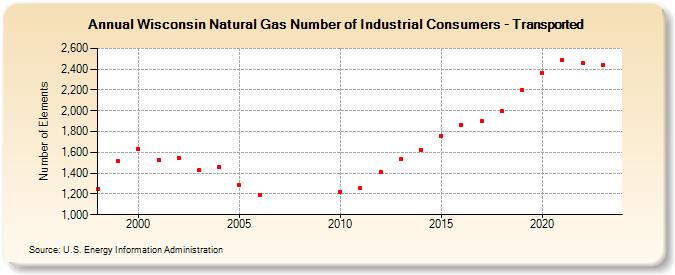
| Wisconsin Natural Gas Number of Industrial Consumers - Transported (Number of Elements) | |||||
| Decade | Year-0 | Year-1 | Year-2 | Year-3 | Year-4 | Year-5 | Year-6 | Year-7 | Year-8 | Year-9 |
|---|---|---|---|---|---|---|---|---|---|---|
| 1990's | 1,246 | 1,515 | ||||||||
| 2000's | 1,630 | 1,529 | 1,543 | 1,426 | 1,463 | 1,284 | 1,188 | |||
| 2010's | 1,222 | 1,253 | 1,414 | 1,532 | 1,626 | 1,761 | 1,866 | 1,899 | 1,998 | 2,204 |
| 2020's | 2,359 | 2,492 | 2,456 | 2,439 | 2,409 |
| - = No Data Reported; -- = Not Applicable; NA = Not Available; W = Withheld to avoid disclosure of individual company data. |
| Release Date: 6/30/2026 |
| Next Release Date: 7/31/2026 |