|
Download Data (XLS File) |
|
|||||
|
|||||
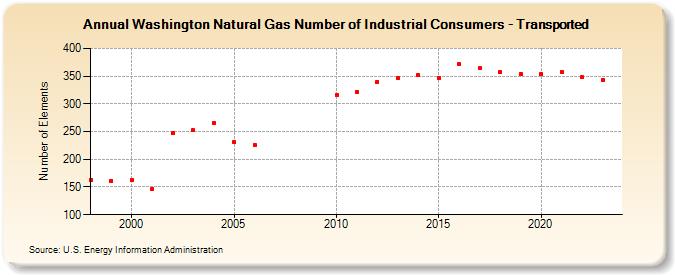
| Washington Natural Gas Number of Industrial Consumers - Transported (Number of Elements) | |||||
| Decade | Year-0 | Year-1 | Year-2 | Year-3 | Year-4 | Year-5 | Year-6 | Year-7 | Year-8 | Year-9 |
|---|---|---|---|---|---|---|---|---|---|---|
| 1990's | 162 | 161 | ||||||||
| 2000's | 163 | 147 | 247 | 252 | 266 | 231 | 226 | |||
| 2010's | 316 | 322 | 340 | 347 | 352 | 347 | 371 | 364 | 357 | 354 |
| 2020's | 354 | 358 | 348 | 343 | 340 |
| - = No Data Reported; -- = Not Applicable; NA = Not Available; W = Withheld to avoid disclosure of individual company data. |
| Release Date: 6/30/2026 |
| Next Release Date: 7/31/2026 |