|
Download Data (XLS File) |
|
|||||
|
|||||
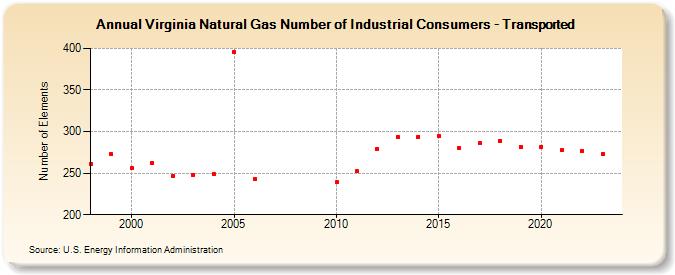
| Virginia Natural Gas Number of Industrial Consumers - Transported (Number of Elements) | |||||
| Decade | Year-0 | Year-1 | Year-2 | Year-3 | Year-4 | Year-5 | Year-6 | Year-7 | Year-8 | Year-9 |
|---|---|---|---|---|---|---|---|---|---|---|
| 1990's | 261 | 273 | ||||||||
| 2000's | 256 | 262 | 247 | 248 | 249 | 396 | 243 | |||
| 2010's | 239 | 252 | 279 | 294 | 294 | 295 | 280 | 286 | 289 | 282 |
| 2020's | 282 | 278 | 277 | 273 | 286 |
| - = No Data Reported; -- = Not Applicable; NA = Not Available; W = Withheld to avoid disclosure of individual company data. |
| Release Date: 6/30/2026 |
| Next Release Date: 7/31/2026 |