|
Download Data (XLS File) |
|
|||||
|
|||||
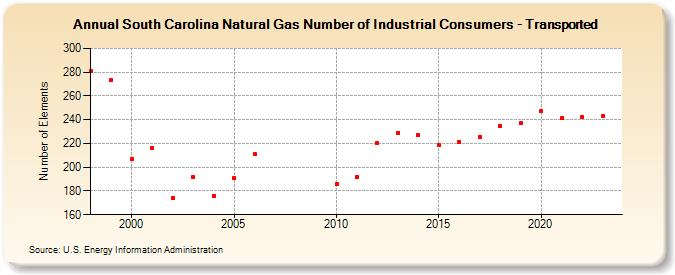
| South Carolina Natural Gas Number of Industrial Consumers - Transported (Number of Elements) | |||||
| Decade | Year-0 | Year-1 | Year-2 | Year-3 | Year-4 | Year-5 | Year-6 | Year-7 | Year-8 | Year-9 |
|---|---|---|---|---|---|---|---|---|---|---|
| 1990's | 281 | 273 | ||||||||
| 2000's | 207 | 216 | 174 | 192 | 176 | 191 | 211 | |||
| 2010's | 186 | 192 | 220 | 229 | 227 | 219 | 221 | 225 | 235 | 237 |
| 2020's | 247 | 241 | 242 | 243 | 218 |
| - = No Data Reported; -- = Not Applicable; NA = Not Available; W = Withheld to avoid disclosure of individual company data. |
| Release Date: 6/30/2026 |
| Next Release Date: 7/31/2026 |