|
Download Data (XLS File) |
|
|||||
|
|||||
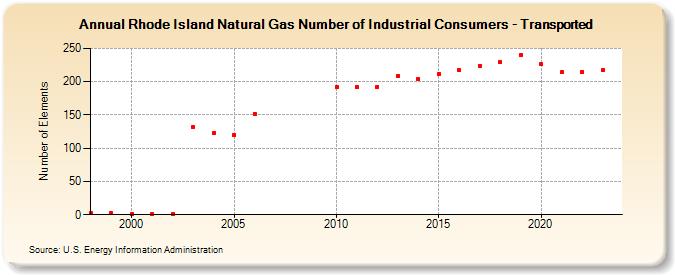
| Rhode Island Natural Gas Number of Industrial Consumers - Transported (Number of Elements) | |||||
| Decade | Year-0 | Year-1 | Year-2 | Year-3 | Year-4 | Year-5 | Year-6 | Year-7 | Year-8 | Year-9 |
|---|---|---|---|---|---|---|---|---|---|---|
| 1990's | 2 | 2 | ||||||||
| 2000's | 1 | 1 | 1 | 132 | 123 | 120 | 152 | |||
| 2010's | 192 | 192 | 192 | 209 | 204 | 212 | 217 | 224 | 229 | 240 |
| 2020's | 226 | 214 | 215 | 217 | 217 |
| - = No Data Reported; -- = Not Applicable; NA = Not Available; W = Withheld to avoid disclosure of individual company data. |
| Release Date: 6/30/2026 |
| Next Release Date: 7/31/2026 |