|
Download Data (XLS File) |
|
|||||
|
|||||
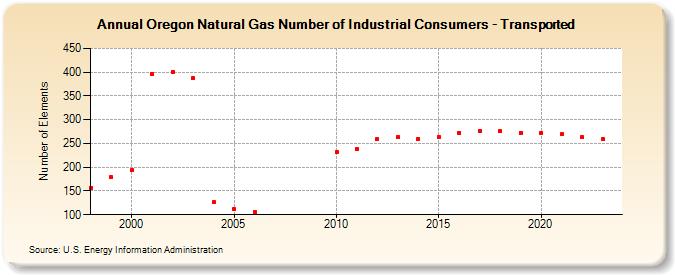
| Oregon Natural Gas Number of Industrial Consumers - Transported (Number of Elements) | |||||
| Decade | Year-0 | Year-1 | Year-2 | Year-3 | Year-4 | Year-5 | Year-6 | Year-7 | Year-8 | Year-9 |
|---|---|---|---|---|---|---|---|---|---|---|
| 1990's | 157 | 179 | ||||||||
| 2000's | 194 | 397 | 401 | 387 | 126 | 112 | 106 | |||
| 2010's | 232 | 238 | 259 | 264 | 260 | 264 | 273 | 276 | 276 | 273 |
| 2020's | 273 | 269 | 263 | 259 | 258 |
| - = No Data Reported; -- = Not Applicable; NA = Not Available; W = Withheld to avoid disclosure of individual company data. |
| Release Date: 6/30/2026 |
| Next Release Date: 7/31/2026 |