|
Download Data (XLS File) |
|
|||||
|
|||||
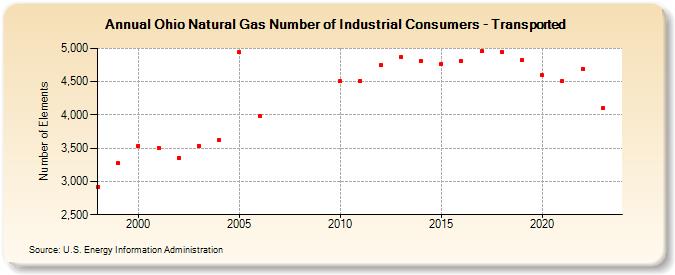
| Ohio Natural Gas Number of Industrial Consumers - Transported (Number of Elements) | |||||
| Decade | Year-0 | Year-1 | Year-2 | Year-3 | Year-4 | Year-5 | Year-6 | Year-7 | Year-8 | Year-9 |
|---|---|---|---|---|---|---|---|---|---|---|
| 1990's | 2,917 | 3,276 | ||||||||
| 2000's | 3,538 | 3,505 | 3,350 | 3,537 | 3,626 | 4,940 | 3,983 | |||
| 2010's | 4,506 | 4,512 | 4,747 | 4,868 | 4,812 | 4,766 | 4,808 | 4,959 | 4,952 | 4,823 |
| 2020's | 4,595 | 4,506 | 4,691 | 4,097 | 4,994 |
| - = No Data Reported; -- = Not Applicable; NA = Not Available; W = Withheld to avoid disclosure of individual company data. |
| Release Date: 6/30/2026 |
| Next Release Date: 7/31/2026 |