|
Download Data (XLS File) |
|
|||||
|
|||||
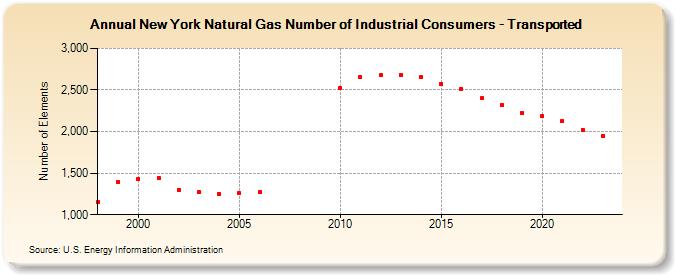
| New York Natural Gas Number of Industrial Consumers - Transported (Number of Elements) | |||||
| Decade | Year-0 | Year-1 | Year-2 | Year-3 | Year-4 | Year-5 | Year-6 | Year-7 | Year-8 | Year-9 |
|---|---|---|---|---|---|---|---|---|---|---|
| 1990's | 1,153 | 1,396 | ||||||||
| 2000's | 1,435 | 1,441 | 1,296 | 1,272 | 1,255 | 1,258 | 1,272 | |||
| 2010's | 2,524 | 2,655 | 2,679 | 2,679 | 2,655 | 2,574 | 2,511 | 2,399 | 2,324 | 2,227 |
| 2020's | 2,188 | 2,124 | 2,024 | 1,945 | 1,894 |
| - = No Data Reported; -- = Not Applicable; NA = Not Available; W = Withheld to avoid disclosure of individual company data. |
| Release Date: 6/30/2026 |
| Next Release Date: 7/31/2026 |