|
Download Data (XLS File) |
|
|||||
|
|||||
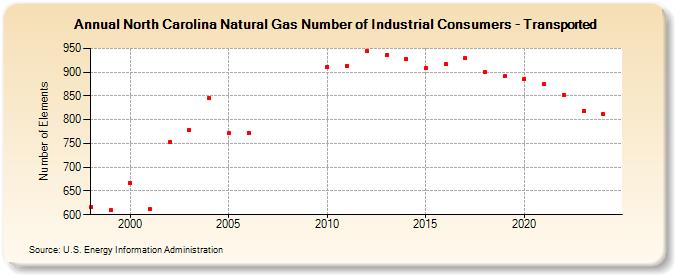
| North Carolina Natural Gas Number of Industrial Consumers - Transported (Number of Elements) | |||||
| Decade | Year-0 | Year-1 | Year-2 | Year-3 | Year-4 | Year-5 | Year-6 | Year-7 | Year-8 | Year-9 |
|---|---|---|---|---|---|---|---|---|---|---|
| 1990's | 616 | 609 | ||||||||
| 2000's | 667 | 611 | 752 | 779 | 845 | 771 | 773 | |||
| 2010's | 911 | 913 | 945 | 936 | 928 | 908 | 917 | 929 | 900 | 891 |
| 2020's | 886 | 875 | 852 | 818 | 811 |
| - = No Data Reported; -- = Not Applicable; NA = Not Available; W = Withheld to avoid disclosure of individual company data. |
| Release Date: 6/30/2026 |
| Next Release Date: 7/31/2026 |