|
Download Data (XLS File) |
|
|||||
|
|||||
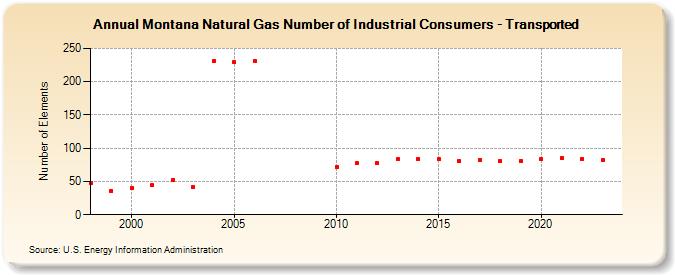
| Montana Natural Gas Number of Industrial Consumers - Transported (Number of Elements) | |||||
| Decade | Year-0 | Year-1 | Year-2 | Year-3 | Year-4 | Year-5 | Year-6 | Year-7 | Year-8 | Year-9 |
|---|---|---|---|---|---|---|---|---|---|---|
| 1990's | 47 | 36 | ||||||||
| 2000's | 40 | 44 | 52 | 42 | 231 | 229 | 231 | |||
| 2010's | 72 | 77 | 77 | 83 | 84 | 83 | 81 | 82 | 81 | 81 |
| 2020's | 83 | 85 | 84 | 82 | 82 |
| - = No Data Reported; -- = Not Applicable; NA = Not Available; W = Withheld to avoid disclosure of individual company data. |
| Release Date: 6/30/2026 |
| Next Release Date: 7/31/2026 |