|
Download Data (XLS File) |
|
|||||
|
|||||
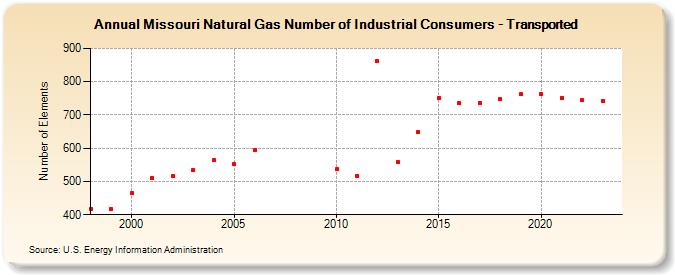
| Missouri Natural Gas Number of Industrial Consumers - Transported (Number of Elements) | |||||
| Decade | Year-0 | Year-1 | Year-2 | Year-3 | Year-4 | Year-5 | Year-6 | Year-7 | Year-8 | Year-9 |
|---|---|---|---|---|---|---|---|---|---|---|
| 1990's | 418 | 417 | ||||||||
| 2000's | 465 | 510 | 515 | 534 | 565 | 551 | 594 | |||
| 2010's | 536 | 517 | 861 | 557 | 648 | 752 | 735 | 736 | 747 | 762 |
| 2020's | 762 | 752 | 744 | 743 | 744 |
| - = No Data Reported; -- = Not Applicable; NA = Not Available; W = Withheld to avoid disclosure of individual company data. |
| Release Date: 6/30/2026 |
| Next Release Date: 7/31/2026 |