|
Download Data (XLS File) |
|
|||||
|
|||||
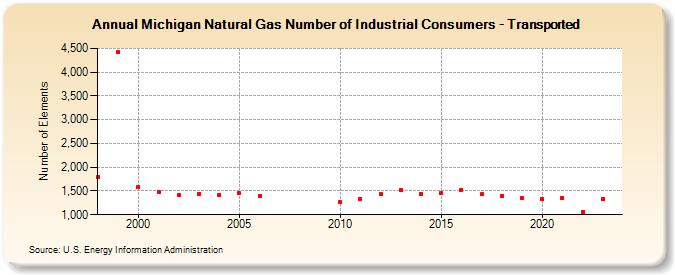
| Michigan Natural Gas Number of Industrial Consumers - Transported (Number of Elements) | |||||
| Decade | Year-0 | Year-1 | Year-2 | Year-3 | Year-4 | Year-5 | Year-6 | Year-7 | Year-8 | Year-9 |
|---|---|---|---|---|---|---|---|---|---|---|
| 1990's | 1,796 | 4,416 | ||||||||
| 2000's | 1,587 | 1,481 | 1,406 | 1,442 | 1,419 | 1,449 | 1,403 | |||
| 2010's | 1,258 | 1,329 | 1,427 | 1,530 | 1,444 | 1,456 | 1,527 | 1,430 | 1,400 | 1,347 |
| 2020's | 1,333 | 1,352 | 1,057 | 1,337 | 1,361 |
| - = No Data Reported; -- = Not Applicable; NA = Not Available; W = Withheld to avoid disclosure of individual company data. |
| Release Date: 6/30/2026 |
| Next Release Date: 7/31/2026 |