|
Download Data (XLS File) |
|
|||||
|
|||||
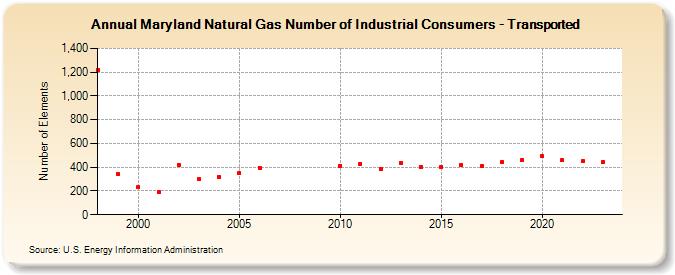
| Maryland Natural Gas Number of Industrial Consumers - Transported (Number of Elements) | |||||
| Decade | Year-0 | Year-1 | Year-2 | Year-3 | Year-4 | Year-5 | Year-6 | Year-7 | Year-8 | Year-9 |
|---|---|---|---|---|---|---|---|---|---|---|
| 1990's | 1,222 | 343 | ||||||||
| 2000's | 231 | 188 | 420 | 301 | 321 | 349 | 397 | |||
| 2010's | 414 | 429 | 387 | 438 | 403 | 403 | 416 | 414 | 445 | 461 |
| 2020's | 494 | 457 | 452 | 443 | 449 |
| - = No Data Reported; -- = Not Applicable; NA = Not Available; W = Withheld to avoid disclosure of individual company data. |
| Release Date: 6/30/2026 |
| Next Release Date: 7/31/2026 |