|
Download Data (XLS File) |
|
|||||
|
|||||
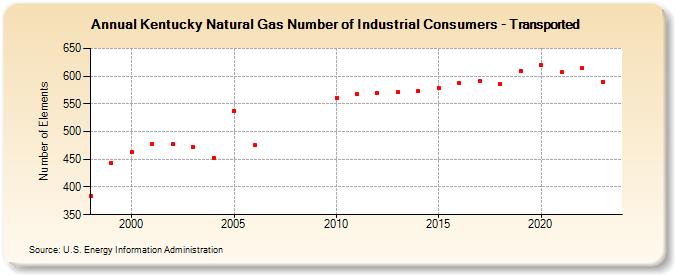
| Kentucky Natural Gas Number of Industrial Consumers - Transported (Number of Elements) | |||||
| Decade | Year-0 | Year-1 | Year-2 | Year-3 | Year-4 | Year-5 | Year-6 | Year-7 | Year-8 | Year-9 |
|---|---|---|---|---|---|---|---|---|---|---|
| 1990's | 383 | 443 | ||||||||
| 2000's | 463 | 478 | 477 | 472 | 453 | 537 | 475 | |||
| 2010's | 561 | 567 | 569 | 571 | 573 | 579 | 587 | 591 | 585 | 609 |
| 2020's | 620 | 607 | 614 | 590 | 595 |
| - = No Data Reported; -- = Not Applicable; NA = Not Available; W = Withheld to avoid disclosure of individual company data. |
| Release Date: 6/30/2026 |
| Next Release Date: 7/31/2026 |