|
Download Data (XLS File) |
|
|||||
|
|||||
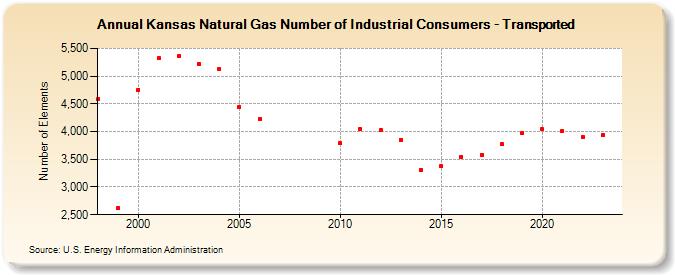
| Kansas Natural Gas Number of Industrial Consumers - Transported (Number of Elements) | |||||
| Decade | Year-0 | Year-1 | Year-2 | Year-3 | Year-4 | Year-5 | Year-6 | Year-7 | Year-8 | Year-9 |
|---|---|---|---|---|---|---|---|---|---|---|
| 1990's | 4,585 | 2,622 | ||||||||
| 2000's | 4,755 | 5,320 | 5,357 | 5,226 | 5,121 | 4,442 | 4,224 | |||
| 2010's | 3,787 | 4,040 | 4,023 | 3,856 | 3,312 | 3,371 | 3,546 | 3,584 | 3,769 | 3,968 |
| 2020's | 4,041 | 4,002 | 3,904 | 3,946 | 3,907 |
| - = No Data Reported; -- = Not Applicable; NA = Not Available; W = Withheld to avoid disclosure of individual company data. |
| Release Date: 6/30/2026 |
| Next Release Date: 7/31/2026 |