|
Download Data (XLS File) |
|
|||||
|
|||||
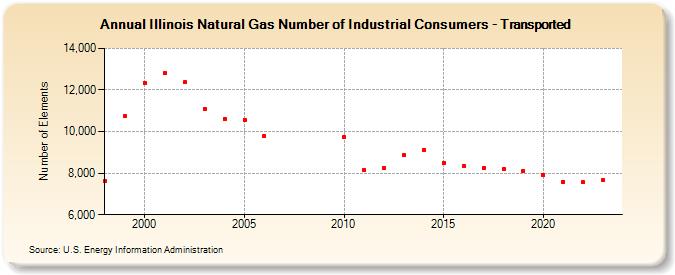
| Illinois Natural Gas Number of Industrial Consumers - Transported (Number of Elements) | |||||
| Decade | Year-0 | Year-1 | Year-2 | Year-3 | Year-4 | Year-5 | Year-6 | Year-7 | Year-8 | Year-9 |
|---|---|---|---|---|---|---|---|---|---|---|
| 1990's | 7,629 | 10,727 | ||||||||
| 2000's | 12,358 | 12,807 | 12,364 | 11,101 | 10,608 | 10,572 | 9,790 | |||
| 2010's | 9,729 | 8,168 | 8,258 | 8,872 | 9,126 | 8,508 | 8,354 | 8,250 | 8,192 | 8,106 |
| 2020's | 7,893 | 7,575 | 7,550 | 7,653 | 7,503 |
| - = No Data Reported; -- = Not Applicable; NA = Not Available; W = Withheld to avoid disclosure of individual company data. |
| Release Date: 6/30/2026 |
| Next Release Date: 7/31/2026 |